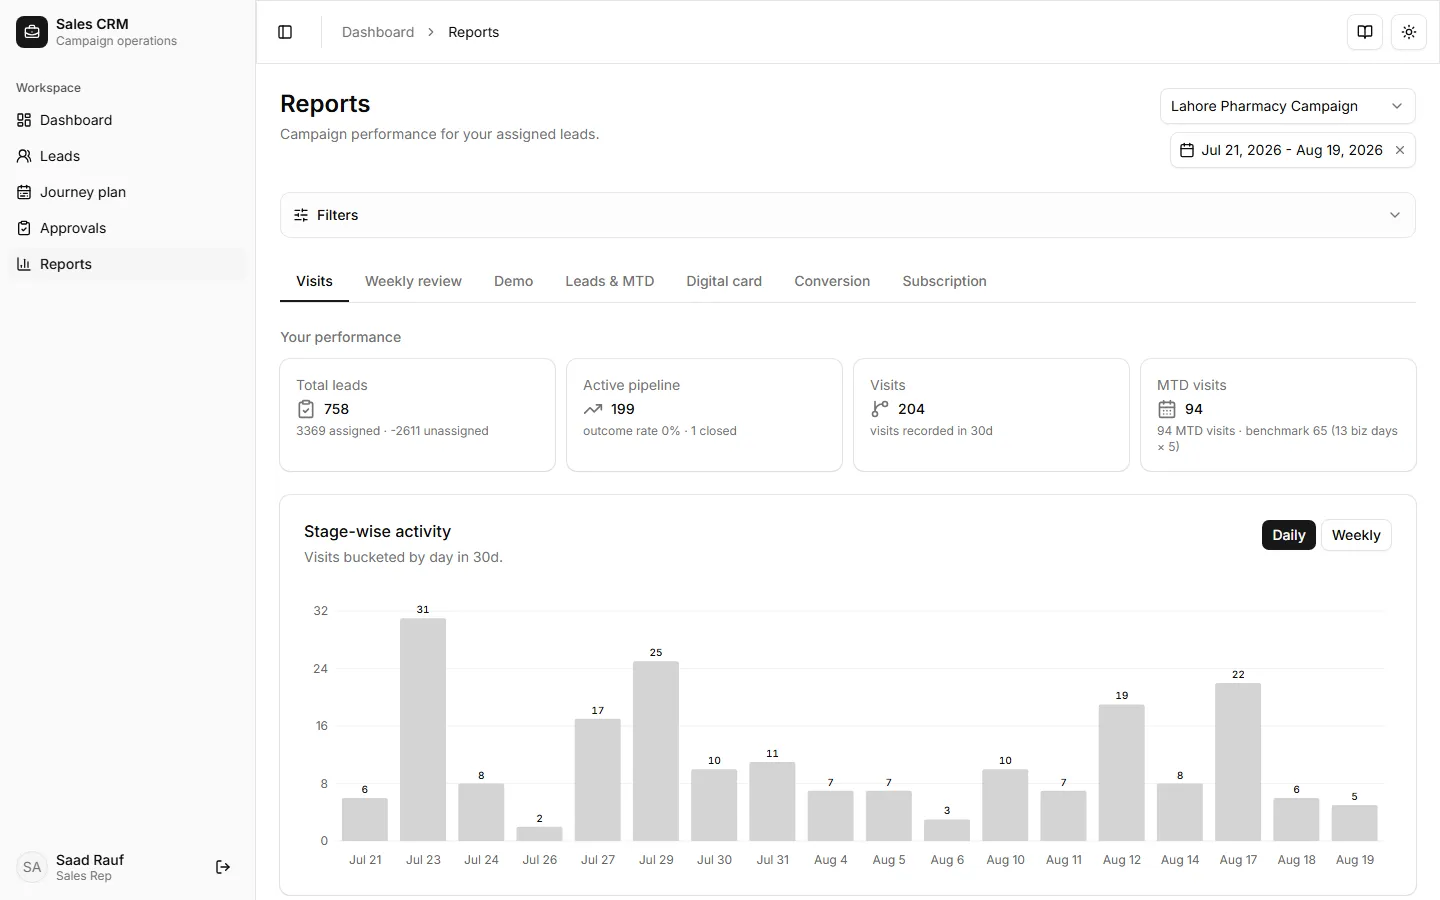
Report tabs
Open Workspace → Reports. The subtitle reads Campaign performance for your assigned leads — every table and chart is filtered to the signed-in rep. Managers see the same tab names but can switch between team overview and individual reps.
Filters
Section titled “Filters”- Campaign — pick the campaign your manager assigned you to (required before tabs populate).
- Date range — defaults to roughly the last 30 days; narrow it for a weekly review.
Reps do not see the manager VIEWING / ASE picker; your account is always the scope.
Tab reference
Section titled “Tab reference”| Tab | Measures | Typical rep use |
|---|---|---|
| Visits | Visit counts and stage-wise activity for your book | Did I hit my visit target this week? |
| Weekly review | Updated vs pending, Hot / Warm / Cold, quality feedback | Qualification week self-check |
| Demo | Demo-specific visit activity | Product launch or demo-day tracking |
| Leads & MTD | Pipeline volume and month-to-date pace | How my book moved this month |
| Digital card | Digital card funnel metrics | Channel campaigns you are running |
| Conversion | Stage-to-stage conversion on your leads | Where my pipeline stalls |
| Subscription | Subscription outcomes | Recurring revenue motions |
Reserved / disabled in the UI today: PJP, New customers, Outcomes.
Each enabled tab includes KPI cards at the top plus charts and tables below.
Related
Section titled “Related”- Read your reports — step-by-step for a weekly check-in
- Report tabs (manager) — same tabs at team scope