Read team reports
When to use this: You need weekly visibility into visits, ASE quality performance, pipeline, and outcomes.
Where: Workspace → Reports
- Open Workspace → Reports.
- Select a campaign, then set the date range.
- Optionally filter by ASE, manager (admin), lead source, Meta ad, stage, ICP, or outcome — same filter bar as the dashboard where applicable.
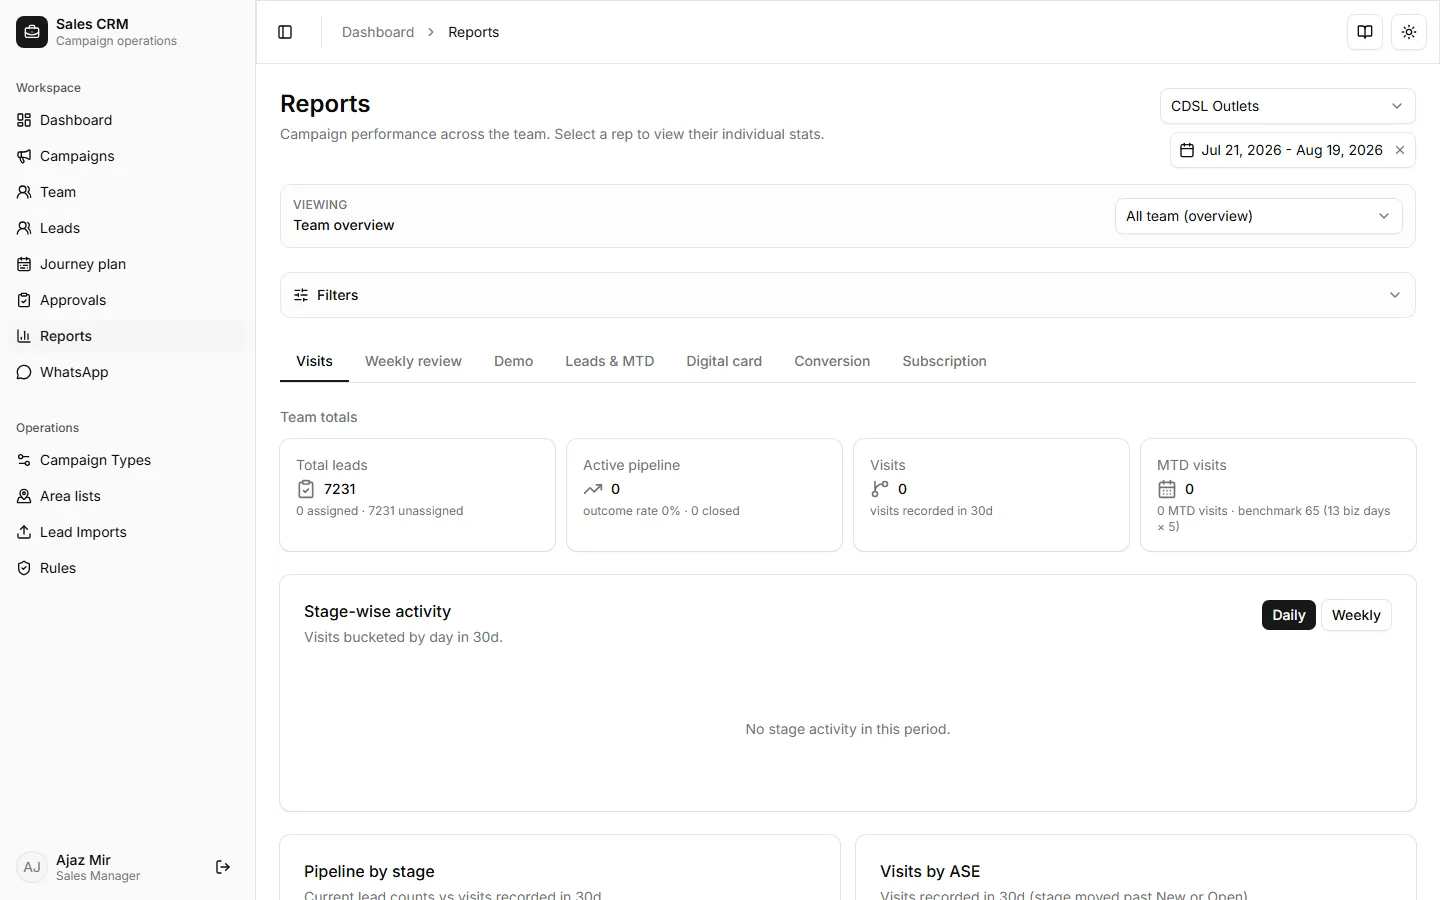
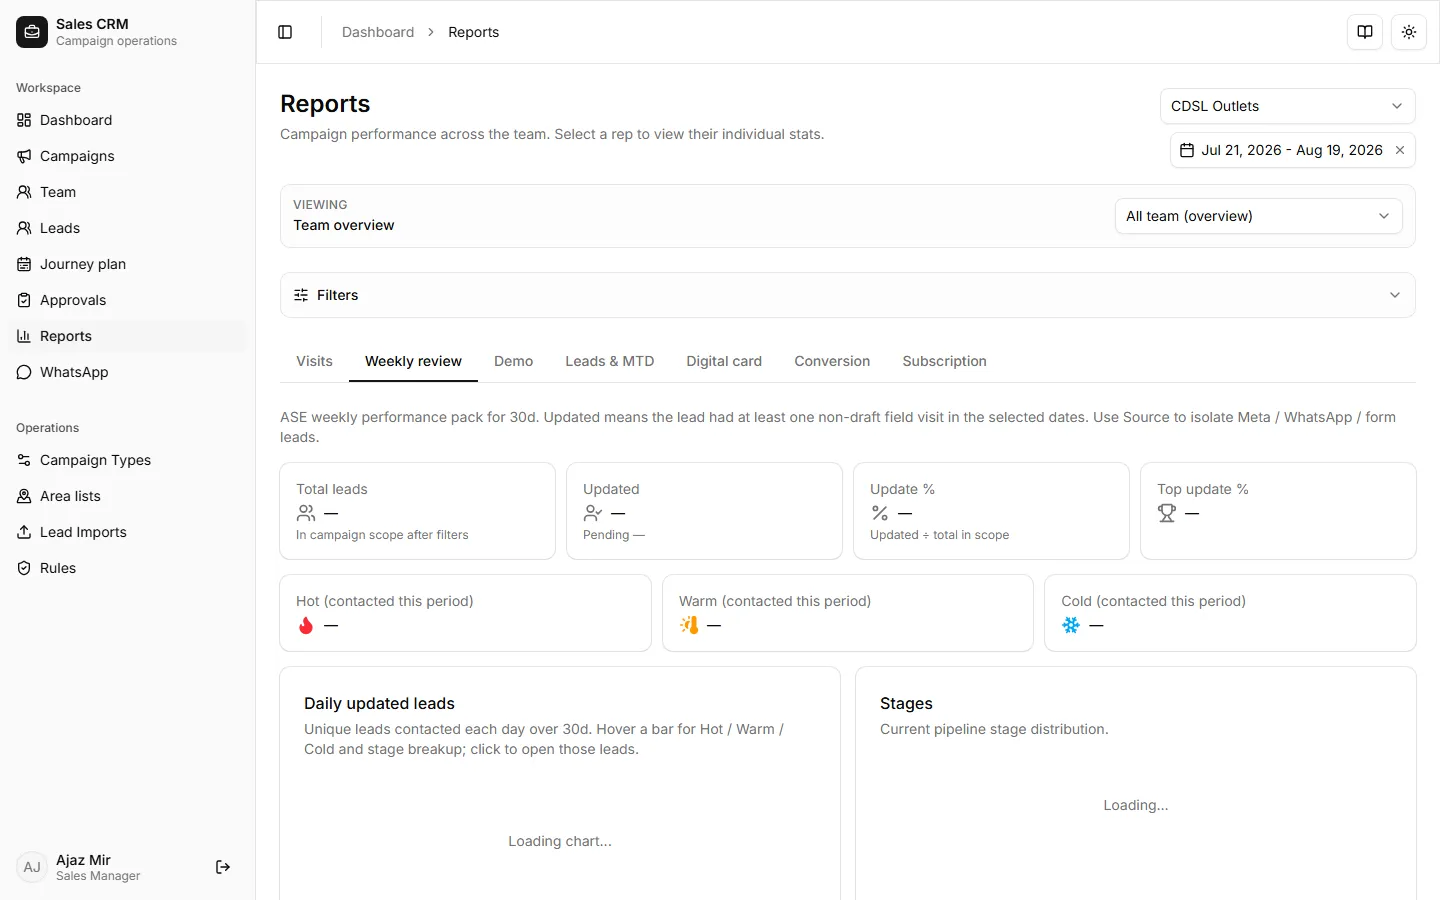
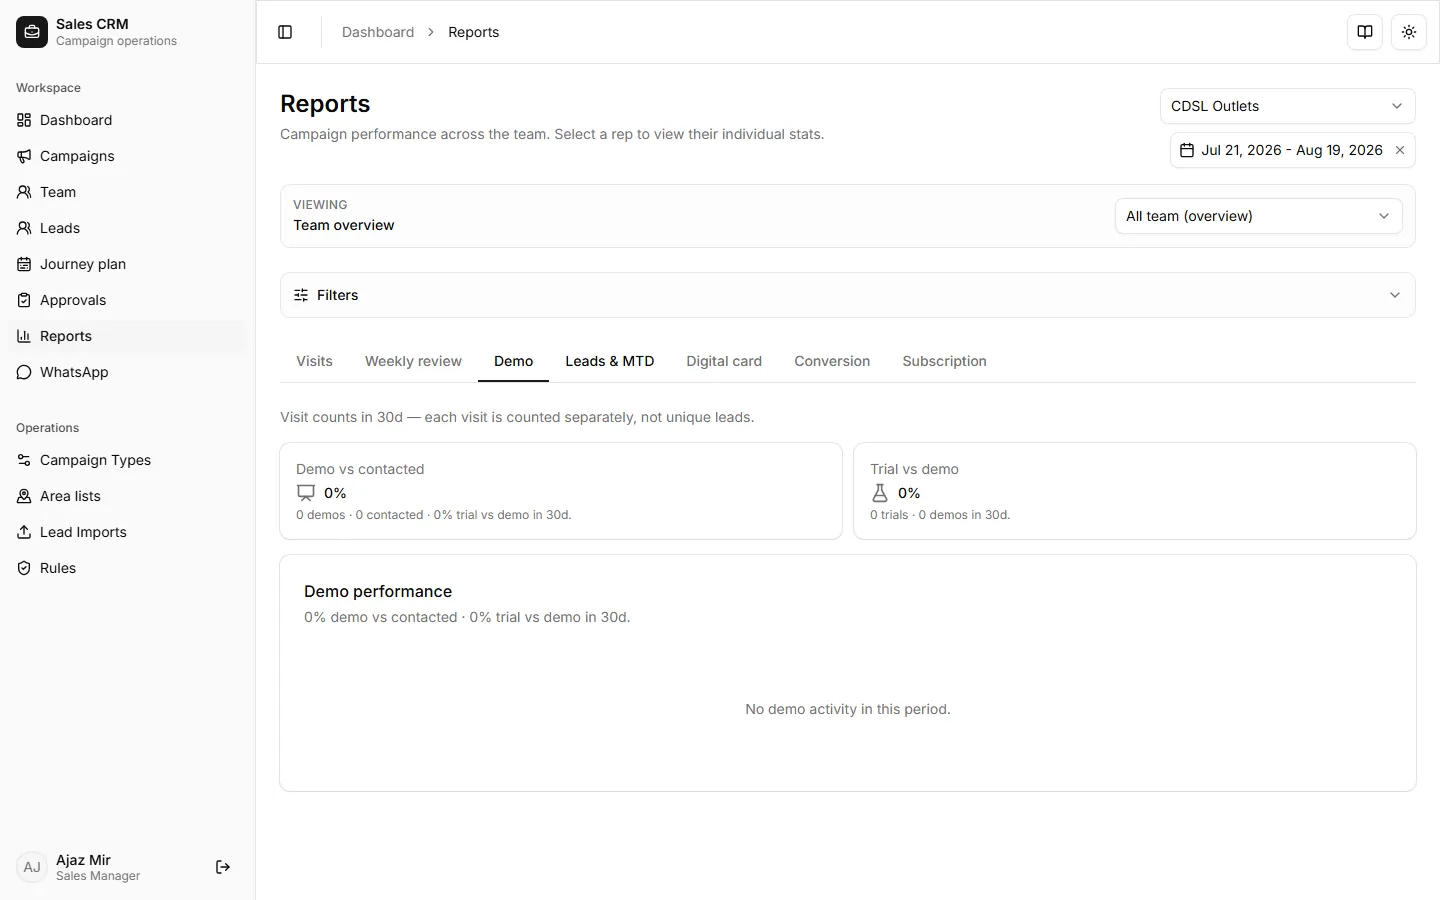
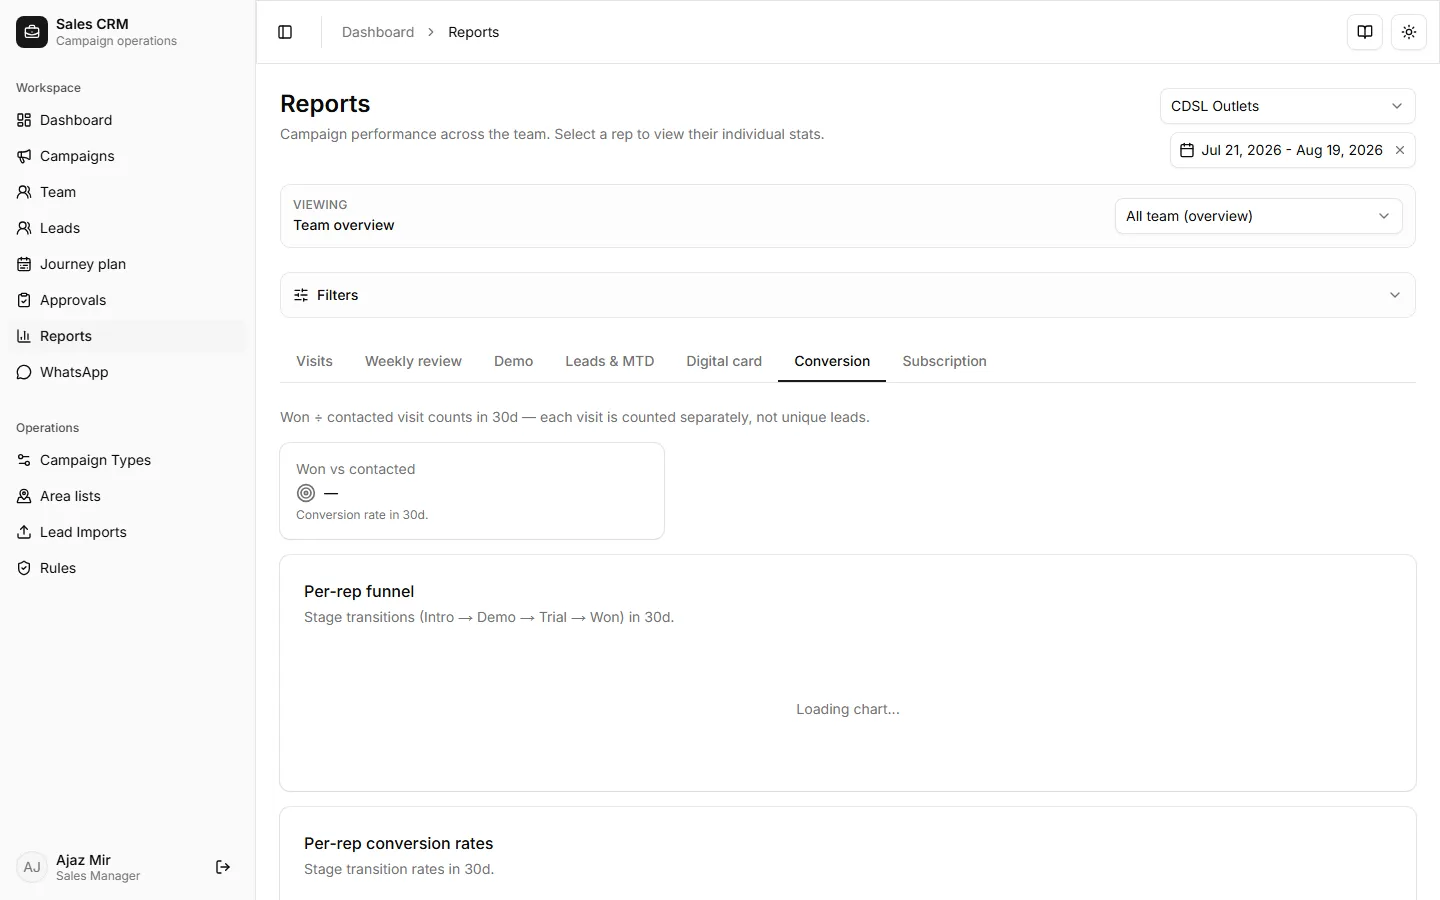
- Switch tabs for the metric you need (see table below). Start with Visits for coverage and Weekly review for ASE quality packs.
| Tab | Use for |
|---|---|
| Visits | Visit counts by rep / stage |
| Weekly review | ASE weekly pack — updated vs pending, Hot / Warm / Cold, quality feedback reasons, ASE snapshot |
| Demo | Demo activity |
| Leads & MTD | Pipeline and month-to-date |
| Digital card | Digital card outcomes |
| Conversion | Stage conversion rates |
| Subscription | Subscription metrics |
Some older tab labels (PJP, New customers, Outcomes) may still appear reserved/disabled in the product.
Weekly review (managers)
Section titled “Weekly review (managers)”Use Weekly review after Meta or field qualification week:
- Totals for leads in scope, updated vs pending, and update %.
- Quality counts (Hot / Warm / Cold).
- Breakdown of Lead Quality Feedback / Reason from visits.
- ASE working snapshot — Overall team or one ASE tab; open lead lists from charts where offered.
If it goes wrong
Section titled “If it goes wrong”| Symptom | Likely cause | Fix |
|---|---|---|
| “Loading chart…” persists | Campaign or date range still loading | Wait a few seconds; pick a campaign from the dropdown |
| Empty KPI cards | No data in selected range | Widen the date range or select All team then drill into a rep |
| Weekly review empty | No Meta / visited leads in range | Widen dates or clear Ad / source filters |
| Rep filter missing | Signed in as rep | Managers/admins see the ASE / viewing pickers; reps are auto-scoped |
Related
Section titled “Related”- Report tabs reference
- Use the dashboard
- Add fields to a campaign type — Lead Quality fields